 Uncorked Conversations
Introduction to Interactive Wine Story Maps in 2026
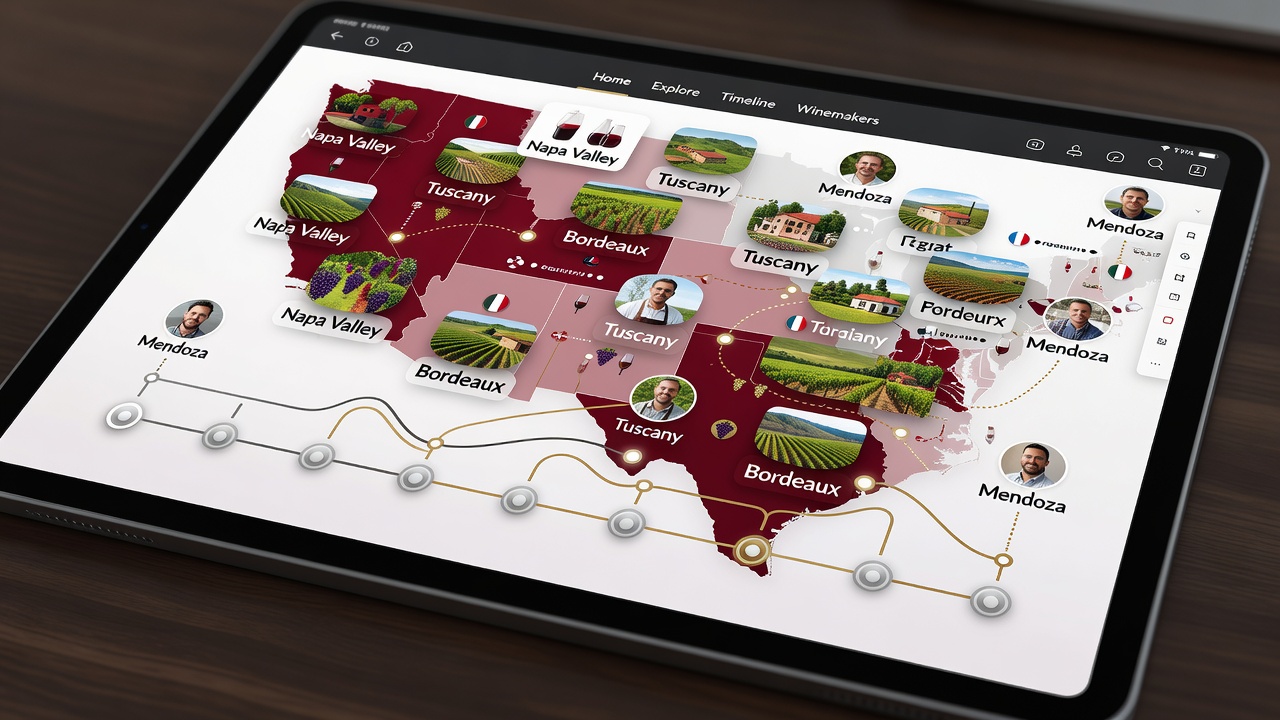
Creating interactive wine story maps allows enthusiasts to bring wine histories, regional legends, and winemaker journeys to life through dynamic digital experiences. These maps combine geographic data with narrative elements, enabling users to explore vineyards, timelines, and personal stories in an engaging format. In 2026, forward-looking creators focus on accessible platforms that support rich multimedia while emphasizing authentic sourcing from archives and direct interviews. The result is a powerful way to preserve cultural heritage and share it with global audiences interested in the evolving world of wine.
This guide provides step-by-step instructions for building such maps, helping you transform raw information into compelling visual stories that resonate with wine lovers worldwide. Whether you are documenting the rise of lesser-known varietals or tracing family legacies across continents, these maps turn static facts into immersive journeys. They also support educational uses in wine schools and tourism boards, fostering deeper connections between drinkers and producers.
Sourcing Data for Authentic Wine Narratives
Effective wine story maps begin with reliable data. Start by accessing historical archives from regional wine associations and public libraries to gather details on vineyard origins and legendary vintages. Supplement this with structured interviews from winemakers, recording their personal accounts of terroir challenges and family traditions. Cross-reference oral histories with geological surveys to add layers of scientific context, such as soil composition maps that explain flavor profiles.
Organize information into layers such as location coordinates, event timelines, and thematic tags. This structured approach ensures maps remain accurate and expandable as new stories emerge from emerging wine areas. Practical steps include creating spreadsheets for raw data entry, verifying sources through multiple channels, and obtaining permissions for personal stories. For example, one project in South America collected over 50 interviews to map the migration of grape varieties, revealing unexpected connections between old-world techniques and new-world innovations.
Always prioritize ethical considerations by crediting contributors and updating datasets regularly to reflect ongoing discoveries in viticulture.
Comparing Free and Paid Mapping Software Options
Selecting the right platform is crucial for 2026 projects. Free tools like OpenStreetMap provide robust base layers for custom overlays without subscription costs, making them ideal for hobbyists experimenting with basic geographic storytelling. They excel at community-driven updates and integration with open data sources.
Paid platforms such as those from Esri offer advanced features including seamless multimedia embedding and collaborative editing. These suit professional creators needing polished outputs for broader distribution. Evaluate based on your project's scale, technical comfort level, and desired interactivity before committing. Consider factors like export options, mobile responsiveness, and community support when deciding.
- Free options: Best for beginners, limited customization, strong community contributions.
- Paid options: Superior analytics, team workflows, premium support and hosting.
- Hybrid approach: Start free then upgrade for complex multimedia projects.
OpenStreetMap serves as an excellent entry point for initial prototyping, while Esri tools provide enterprise-level reliability for finished products.
Integrating Multimedia Elements Effectively
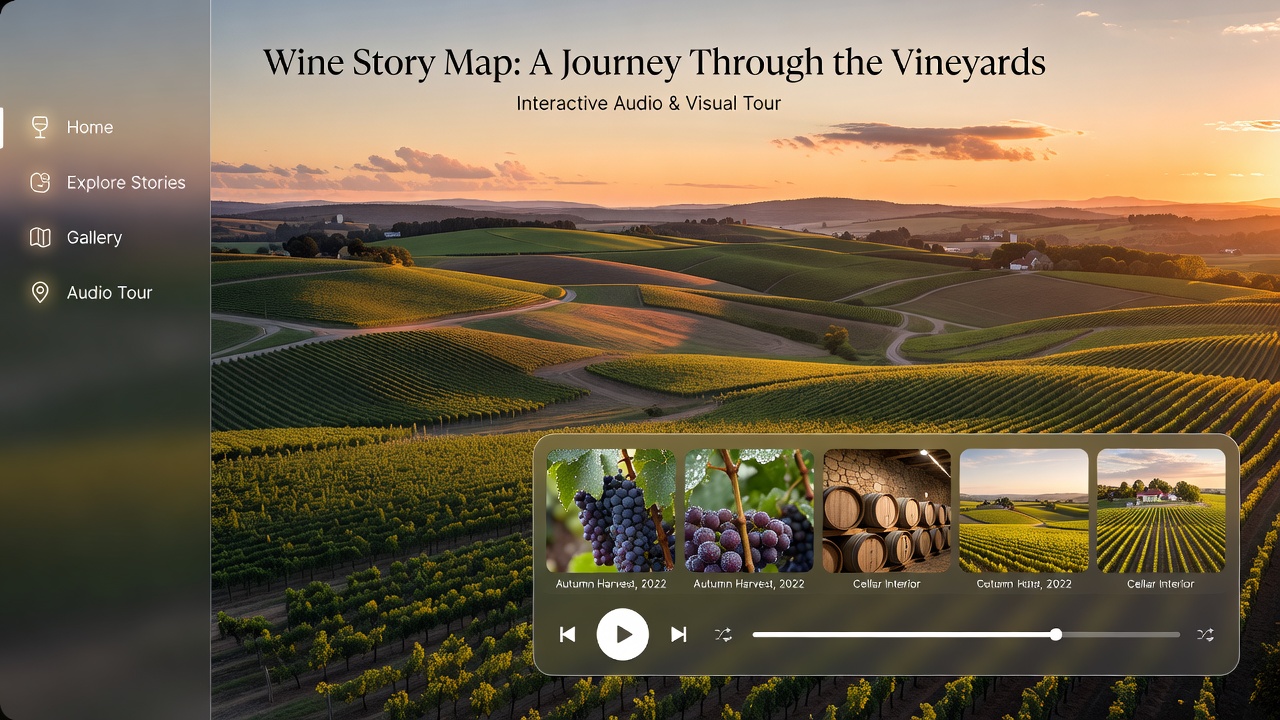
Enhance maps by embedding photos of vineyard landscapes and audio clips from winemaker interviews. Use supported file formats that load quickly across devices to maintain user engagement. Position multimedia at key story points, such as clickable markers revealing tasting notes or historical anecdotes. Test all elements on various screen sizes to ensure smooth performance, and compress files appropriately without sacrificing quality.
Ensure accessibility by adding captions and transcripts, broadening reach to diverse audiences interested in wine culture. Advanced techniques include syncing audio with animated timelines or linking photos to seasonal changes in the vineyard. Real examples show how these additions transform a simple map into a sensory experience, allowing users to almost taste the terroir through visual and auditory cues. Always back up multimedia assets and choose platforms with reliable CDN support for global delivery.
Real-World Examples from Emerging Regions
Successful maps often highlight lesser-known areas. For instance, projects mapping volcanic soil influences in new volcanic wine zones demonstrate how visual timelines connect geology to flavor profiles. Another example showcases family-owned estates in high-altitude regions, using layered routes to trace harvest journeys and cultural festivals tied to the grape cycle.
These cases illustrate how focused narratives can spotlight unique wine stories while driving interest in sustainable practices. Additional examples include maps from Eastern European emerging zones that blend folklore with modern production data, creating educational resources for both locals and international visitors. Such projects frequently lead to increased tourism and stronger community ties among producers.
SEO Tips for Sharing Wine Story Maps Online
Optimize visibility by incorporating relevant keywords in map titles, descriptions, and alt text. Host maps on dedicated pages with structured data markup to improve search engine indexing. Share across wine-focused communities and encourage backlinks from regional tourism sites. Monitor performance with analytics tools to refine content strategies over time.
Regular updates with fresh stories keep content current and encourage repeat visits from enthusiasts. Additional tactics involve creating companion blog posts, optimizing image metadata, and participating in relevant forums to build authority around your maps.
Frequently Asked Questions
How do I handle large datasets without performance issues?
Break data into modular layers and test map loading speeds on multiple devices during development. Use caching strategies and simplify complex polygons where possible.
What formats work best for embedding audio clips?
MP3 files with optimized compression ensure compatibility and quick playback across browsers. Consider adding fallback options for older devices.
Can maps be updated after initial publication?
Yes, most modern platforms support real-time edits, allowing seamless addition of new interview content or regional expansions without rebuilding from scratch.
What common technical hurdles arise with multimedia integration?
Bandwidth limitations and format incompatibilities are frequent; always test across browsers and provide alternative text descriptions.
Conclusion
Building interactive wine story maps in 2026 empowers creators to preserve and share the rich tapestry of wine culture. By focusing on quality data, thoughtful software selection, and engaging multimedia, your projects can inspire deeper appreciation for winemaking traditions and emerging regions alike. Start small, iterate based on feedback, and watch your stories reach new audiences around the world.
No comments yet. Be the first!